Generalizing output graphics
Those who have tried to play with the thinkbot-powered simulation demo would have soon realised one of its fundamental limitations: it assumes that the output quantity is a deformation-like vector field in 3D for the purposes of visualization. To overcome this limitation, I’ve started to spec out some generalizations to thinkbot and Mechanics Academy’s visualisation framework to allow for a wider range of output quantities.
When implemented, you should be able to plot meshes, scalar and vector fields (both as arrow glyphs and as warped meshes) in 2- and 3-dimensions. To help you imagine these (and to remind me of the different cases!), I’ve provided some examples below from different FEniCS demos that motivate this upgrade:
In 2D
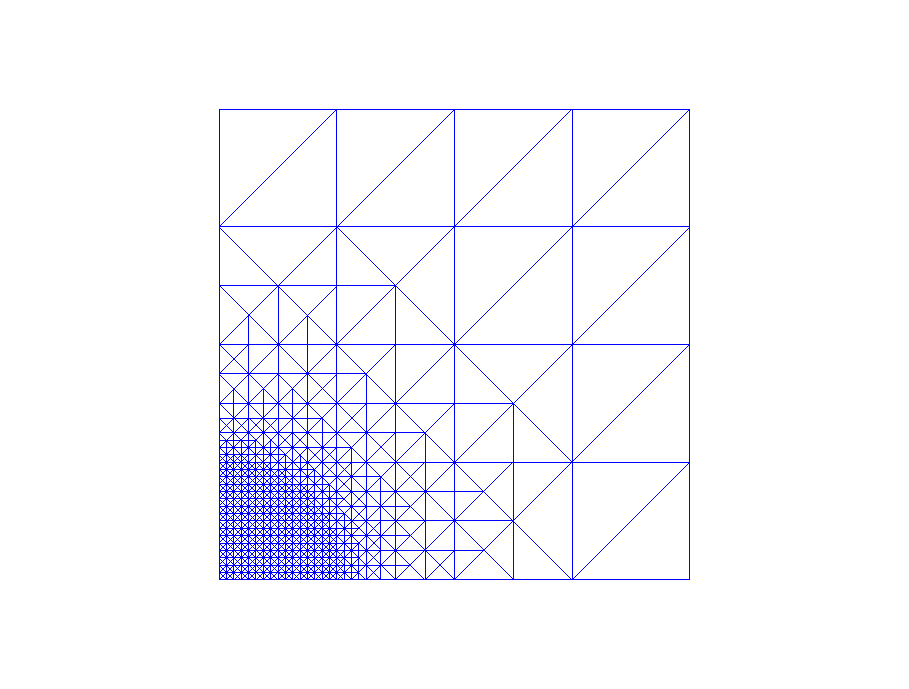
Computational mesh
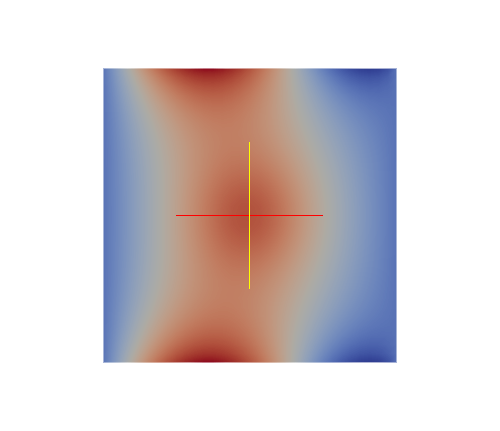
Scalar field, as a color map
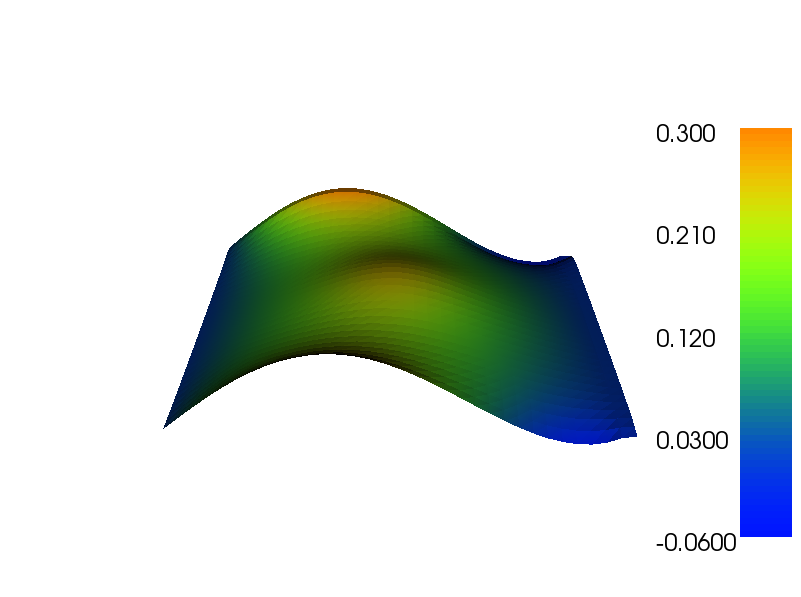
Scalar field, as colors and z-height
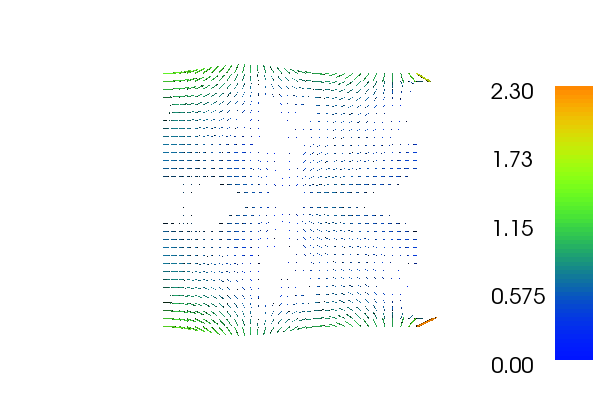
Vector field, as arrow glyphs
In 3D
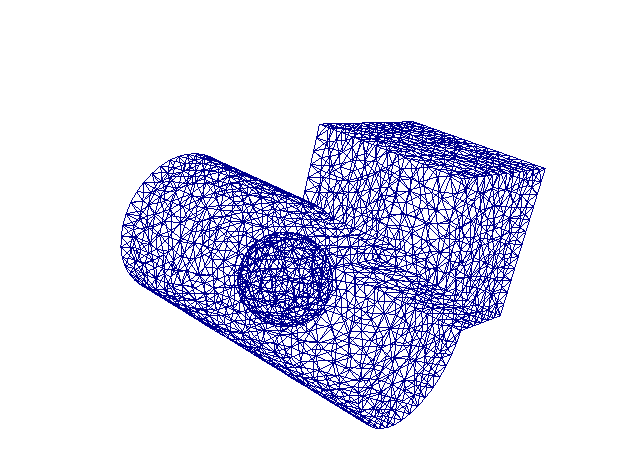
Computational mesh
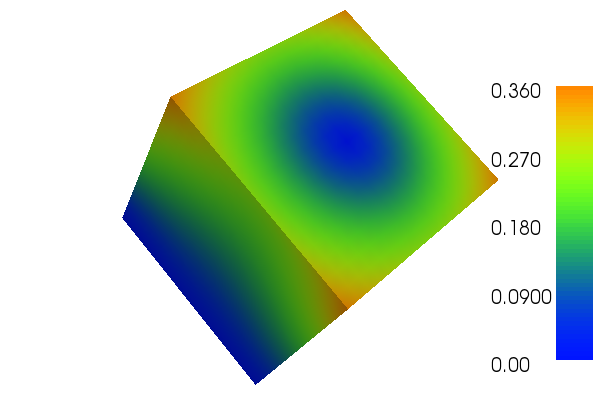
Scalar field, as a color map
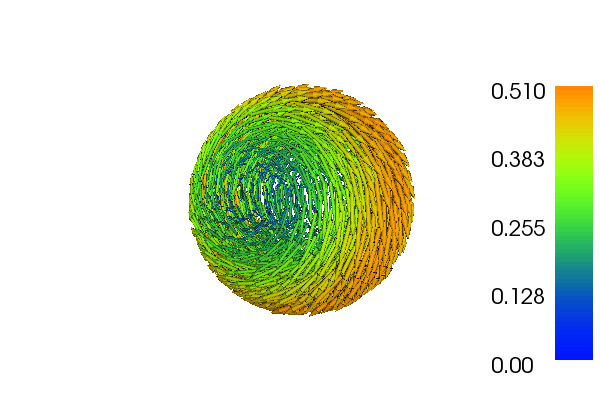
Vector field, as arrow glyphs
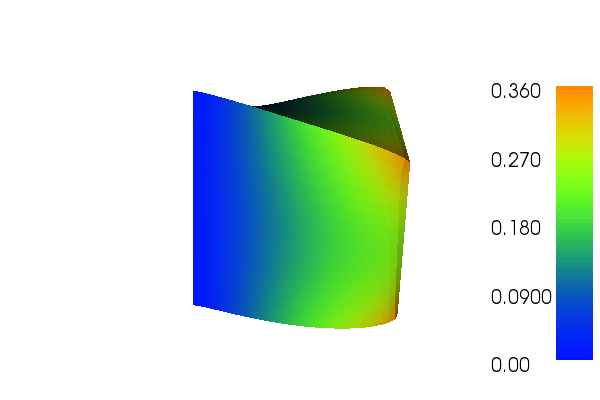
Vector field, as mesh distortion
Stay tuned for an updated demo showing off some of this new stuff soon!
July 20, 2013 — Read other entries
About
Mechanics Academy aims to be a stimulating and fun environment where students learn topics in mechanics and applied mathematics.
Recent entries
-
Meet the new thinkbot
September 15, 2013
-
Generalizing output graphics
July 20, 2013
-
From alpha to beta
June 10, 2013
-
Scientific computing as a service
March 28, 2013
-
Tossing rocks
February 26, 2013